

Dinosaur park analysis: case study
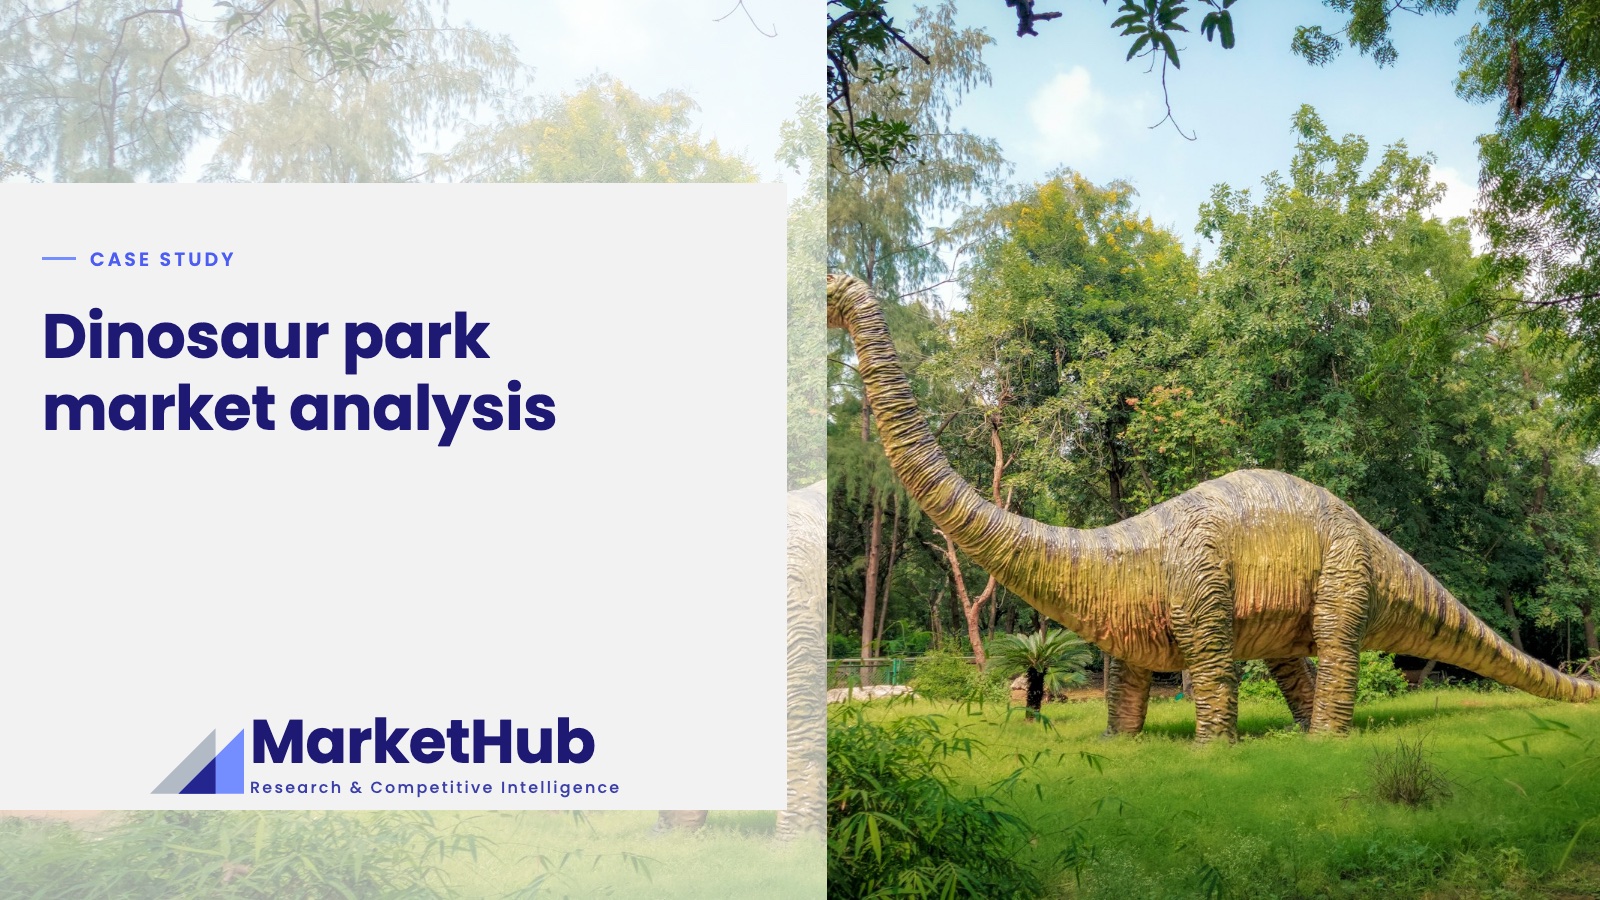
How many moving dinosaur parks are there in Poland?
Poland has 6 dinosaur parks with moving models. One of them has more moving dinosaurs than any other park in Europe.
What was the aim of the dinosaur park analysis in Europe?
The main aim of our market research was to find out how many dinosaur amusement parks there are in Europe and which park has the most dinosaurs, especially moving ones. The results were surprising, mainly because Poland came out on top among the countries with the largest number of parks of this kind.
How were moving dinosaur parks in Europe researched?
The parks were identified through searches in engines such as Google, Yandex, Seznam and Bing, and each park was checked for its number of figures and its area.
To identify the parks, we ran detailed searches in general search engines such as Google, Yandex, Seznam and Bing. We used the following keywords (in English and in the local language of each country): "amusement park with moving dinosaurs", "moving dinosaur parks" and "animatronic dinosaurs". We narrowed down the results with Boolean operators. For each park we checked the number of figures and the area. We used these two indicators to build the ranking of amusement parks with moving dinosaurs in Europe. The analysis drew on the parks' websites and internal documents (e.g. development plans). We also used information from social media, such as promotional videos and park maps. Google Maps (Street View) was another helpful tool, as it let us "visit" each park online. We also looked at travel blog posts with customer reviews, as well as press articles. To establish the area, we used data from the park's website or an online map tool that measures land area.
How many moving dinosaur parks are there in Europe?
Our analysis showed that there are 82 dinosaur amusement parks in Europe with at least one moving figure. Most of them are in the United Kingdom (14 parks), France (9 parks), and Poland, Russia and Ukraine (6 parks each). Of the European countries surveyed, 25 have a dinosaur park with at least one moving figure, while 13 countries have none at all (e.g. Finland, Norway and Portugal). 72% of the parks surveyed have 10 to 49 figures, 13.4% have 50–100 figures and 9.6% have fewer than 10 figures. Only a few parks in Europe have more than 100 figures (4.8%).
Which dinosaur park in Europe has the most moving figures?
The research carried out by MarketHub showed that the Polish Zatorland Amusement Park has the most moving figures in Europe. The park has more than 100 figures, more than half of which are dinosaur models that move and make sounds. Some of the parks surveyed have more figures, but only a few of them move. For example, a park in France (Prehisto-Dino Park) has as many as 150 figures, but only one of them moves. Another example is the German park Dinosaurierland Rügen, with approx. 125 figures, of which only 11 move. Other parks with over 100 figures include the Dutch Dinoland, the Greek Dino Park Greece and the Romanian Dino Parc (each has around 100 figures, but only a few moving ones). We also looked at a second indicator that shows how far ahead the largest parks are: park area. The largest park by area is Givskud Zoo in Denmark (65 ha), although this area also includes the zoo, which is part of the park. In second place is the Polish Zatorland Amusement Park, with an area of 20 ha, followed by the French park mentioned above (Prehisto-Dino Park) and the Dutch Dino Experience Park.
The table below shows the result of the analysis: the top 20 parks with moving dinosaurs in Europe by number of figures and area in hectares.
What does the ranking of dinosaur parks in Europe look like?
The ranking of parks with moving dinosaurs in Europe is led by the Polish Zatorland Amusement Park (20 ha, 101 figures), followed by France's Prehisto-Dino Park and Germany's Dinosaurierland Rügen.
Rank
Park name
Country
Area (ha)
Number of figures*
1
Poland
20 ha
101 (more than half are moving figures)
2
France
12 ha
150 (only one moving figure)
3
Germany
9.5 ha
125 (approx. 11 moving figures)
4
Netherlands
4 ha
101 (a few moving figures)
5
Greece
4 ha
100 (a few moving figures)
6
Romania
3.5 ha
100 (one moving figure)
7
Austria
4 ha
90
8
France
7 ha
88
9
Croatia
8.5 ha
80
10
Netherlands
10 ha
approx. 70
11
France
2 ha
approx. 60
12
Denmark
65 ha
approx. 55
13
France
7 ha
55
14
Lithuania
7 ha
51
15
Lithuania
9 ha
approx. 50
16
Russia
2 ha
50
17
France
3.5 ha
45
18
France
1.3 ha
45
19
Russia
6.4 ha
43
20
Romania
2 ha
42
Source: MarketHub analysis. * The selected parks with the most figures (>100 figures) were analysed in more depth to estimate the number of moving figures (estimates given in brackets).
Due to a non-disclosure agreement, we cannot share details or all elements of the market analysis in this case study.
Need data on your own industry in Poland?
Market Scan by MarketHub offers market reports in PDF, emailed to you within 3 business days after payment.
See Market Scan